

Intent-based cross-chain bridges have transformed how we move assets between blockchains, letting solvers front their own liquidity to fulfill user intents instantly. This solver-centric model boosts efficiency but opens the door to liquidity exhaustion attacks, a fresh threat that drains solver pools and disrupts settlements. Recent analysis of 3.5 million cross-chain intents worth $9.24 billion from June to November 2025 spotlights the peril across protocols like Mayan Swift, Across, and deBridge.
These attacks exploit the reliance on off-chain solvers, who compete to execute intents profitably. Attackers flood the system with low-margin or fake intents, exhausting available liquidity and forcing legitimate solvers to wait or fail. The result? Delayed settlements, profit erosion, and potential cascading failures in interconnected DeFi ecosystems. As a portfolio strategist, I've seen how such vulnerabilities amplify systemic risk, turning bridges from connectors into chokepoints.
Ethereum Technical Analysis Chart
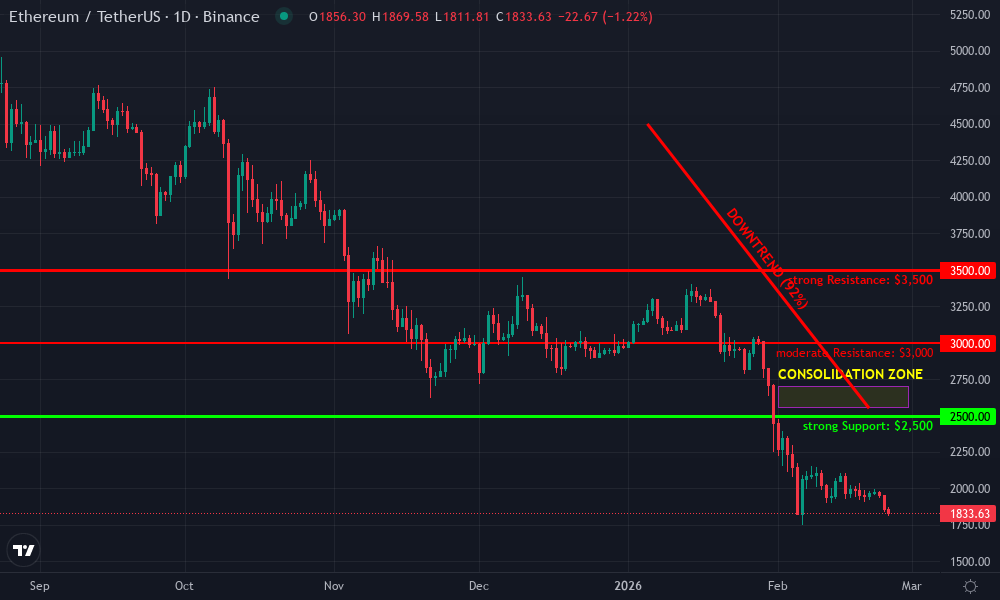
Analysis by Market Analyst | Symbol: BINANCE:ETHUSDT | Interval: 1D | Drawings: 6
Technical Analysis Summary
To annotate this ETHUSDT chart in my balanced technical style, start by drawing a prominent downtrend line connecting the peak high around $4,500 on 2026-01-05 to the recent low near $2,550 on 2026-02-20, using 'trend_line' tool with red color for bearish bias. Add horizontal support at $2,500 and resistance at $3,000 using 'horizontal_line'. Place fib_retracement from the major swing low at $2,500 (2026-02-10) to high $4,500 (2026-01-05) to highlight 38.2% retracement near $3,400 and 61.8% at $3,000. Mark the recent consolidation range with 'rectangle' from 2026-02-01 $2,550 to 2026-02-28 $2,700. Use 'arrow_mark_down' at the breakdown point on 2026-01-20. Add 'callout' texts for key supports/resistances and volume notes. Finally, 'long_position' suggestion box near $2,550 entry with stop below $2,450.
Risk Assessment: medium
Analysis: High volatility from recent crash but signs of stabilization; cross-chain risks add uncertainty but technicals suggest bottoming
Market Analyst's Recommendation: Consider longs on confirmation above $2,700 with tight stops, aligning with medium risk tolerance
Key Support & Resistance Levels
📈 Support Levels:
- $2,500 - Strong multi-touch base coinciding with prior low strong
- $2,400 - Psychological extension support weak
📉 Resistance Levels:
- $3,000 - Initial retracement resistance from fib 61.8% moderate
- $3,500 - Swing high resistance from mid-rally strong
Trading Zones (medium risk tolerance)
🎯 Entry Zones:
- $2,550 - Bounce from strong support with volume pickup potential medium risk
🚪 Exit Zones:
- $3,200 - Profit target at minor resistance/fib level 💰 profit target
- $2,400 - Stop loss below key support to limit downside 🛡️ stop loss
Technical Indicators Analysis
📊 Volume Analysis:
Pattern: decreasing on downside after spike on breakdown
High volume on initial drop indicates distribution, now tapering suggesting exhaustion
📈 MACD Analysis:
Signal: bearish crossover with weakening momentum
MACD line crossed below signal in Jan, histogram contracting recently hinting reversal potential
Applied TradingView Drawing Utilities
This chart analysis utilizes the following professional drawing tools:
Disclaimer: This technical analysis by Market Analyst is for educational purposes only and should not be considered as financial advice. Trading involves risk, and you should always do your own research before making investment decisions. Past performance does not guarantee future results. The analysis reflects the author's personal methodology and risk tolerance (medium).
How Liquidity Exhaustion Preys on Solver Dynamics
In traditional bridges, liquidity sits locked in pools, vulnerable to drains but predictable. Intent-based designs shift this to dynamic solver competitions, where profitability hinges on margins and speed. Attackers game this by replaying parameterized intents, simulating floods that mimic organic demand but target weak spots.
The arXiv study details a replay-based simulation revealing deBridge's exposure: 210 historical attacks averaged $286.14 net profit each, with 80.5% succeeding. Across held firm thanks to deep liquidity and slim margins, while Mayan Swift faltered only in stress tests. Byzantine tactics worsened it, slashing availability and costing solvers up to $978 every 16 minutes. Optimized strategies slashed attack costs by 90.5%, democratizing exploits for smaller adversaries.
This isn't theoretical. Cross-chain bridges claimed $1.317 billion in 2022 exploits alone, per CertiK, underscoring persistent cross-chain messaging risks. Yet liquidity exhaustion adds a layer of subtlety, evading static audits by mimicking normal traffic.
Dissecting Protocol Susceptibilities
deBridge's high solver profitability made it a prime target, with concentrated liquidity amplifying exhaustion risks. Across's model, emphasizing broad participation and low margins, proved resilient. Mayan Swift showed promise but buckled under simulated floods, hinting at scalability gaps.
| Protocol | Attack Instances | Profitability (%) | Key Vulnerability |
|---|---|---|---|
| deBridge | 210 | 80.5% | High solver margins |
| Across | Low | N/A | Robust liquidity |
| Mayan Swift | Stress-test only | Variable | Concentration risks |
These patterns demand cross-chain audit scanners attuned to intent flows, not just code. Tools like XChainWatcher, powered by Datalog engines, flag anomalies in real-time, catching failed exploits and rogue transactions as seen in Ronin and Nomad breaches.
Attack Economics: From Theory to Profitable Reality
Profitability drives adoption, but it backfires here. Solvers chase intents with positive expected value, but exhaustion flips the script, turning their capital into attacker bait. The study's optimization reduced barriers, making intent-based bridge vulnerabilities accessible beyond whales.
Byzantine failures compound this, suppressing intents across chains and eroding trust. In my view, protocols ignoring solver diversity court disaster; concentration invites exhaustion. Read more on why bridges magnetize hackers through centralization flaws.
Real-time monitoring emerges as the pragmatic shield, with XChainWatcher proving its mettle on past exploits. Yet, as bridges proliferate, scanning for blockchain bridge exploits must evolve beyond hindsight.
Cross-Chain Messaging Risk Scanners steps into this gap with precision tools tailored for intent-based protocols. Our platform scans solver dynamics in real-time, flagging exhaustion patterns before they cascade. By analyzing intent volumes, profitability signals, and liquidity depths across chains, we assign risk scores that guide developers and users alike.
Building Resilient Defenses Against Exhaustion
Solvers need incentives aligned with security, not just speed. Protocols can counter by capping intent quotas per solver, diversifying liquidity sources, and implementing dynamic pricing that penalizes floods. XChainWatcher's Datalog-driven model excels here, parsing cross-chain events to detect replays and byzantine behaviors that static audits miss. In Ronin and Nomad cases, it pinpointed exploits leading to hundreds of millions in losses, proving proactive scanning trumps reactive patches.
Yet resilience demands more than detection. Economic deterrents, like slashing solver stakes for suspicious activity, raise the cost of attacks. Diversifying solver pools reduces concentration risks, a lesson from deBridge's woes. As someone balancing portfolios across assets, I advocate treating bridges like over-leveraged positions: hedge with multi-path routing and insured liquidity layers.
Regulators eye this space too, pushing for adaptive frameworks that protect without stifling innovation. NIH insights on digital asset risks underscore cross-border coordination, vital as exploits ripple globally.
Scanning Tools in Action: Practical Risk Assessment
Imagine deploying a bridge: first, feed our scanner historical intents like the 3.5 million studied. It simulates exhaustion vectors, scoring vulnerabilities on a 1-10 scale. deBridge might flag at 8.2 for margin exposure, Across at 3.1 for robustness. Integrate with CI/CD pipelines for audits that evolve with code.
Our transaction anomaly detection catches subtle replays, while exploit vector mapping maps attack surfaces. Pair this with AI-driven reviews from firms like QuillAudits, and you've got layered defense.
Risk Scores for Protocols
| Protocol | Exhaustion Risk Score | Key Metric | Mitigation Readiness |
|---|---|---|---|
| deBridge | 8.2 | High margins | Low |
| Across | 3.1 | Deep liquidity | High |
| Mayan Swift | 6.4 | Stress sensitivity | Medium |
Users benefit too. Before bridging $10k in tokens, check our dashboard for live solver health. Green across chains? Proceed. Yellow flags? Reroute or wait. This pragmatism minimizes exposure in volatile markets.
Looking ahead, as intent protocols scale to handle trillions, exhaustion risks will mutate with solver AI and zero-knowledge proofs. Stay vigilant with tools benchmarking against baselines like the arXiv optimizations. Protocols embracing scanners will thrive, while laggards face the chokepoint fate.
Bridges connect chains, but unchecked vulnerabilities sever trust. By prioritizing solver safeguards and real-time vigilance, the ecosystem hardens against liquidity exhaustion and beyond. Diversify your cross-chain paths; it's the sharpest hedge in this interoperable frontier.



No comments yet. Be the first to share your thoughts!